
Figures
Latest in situ program data figures can be found here.
Latest flask program data figures can be found here.
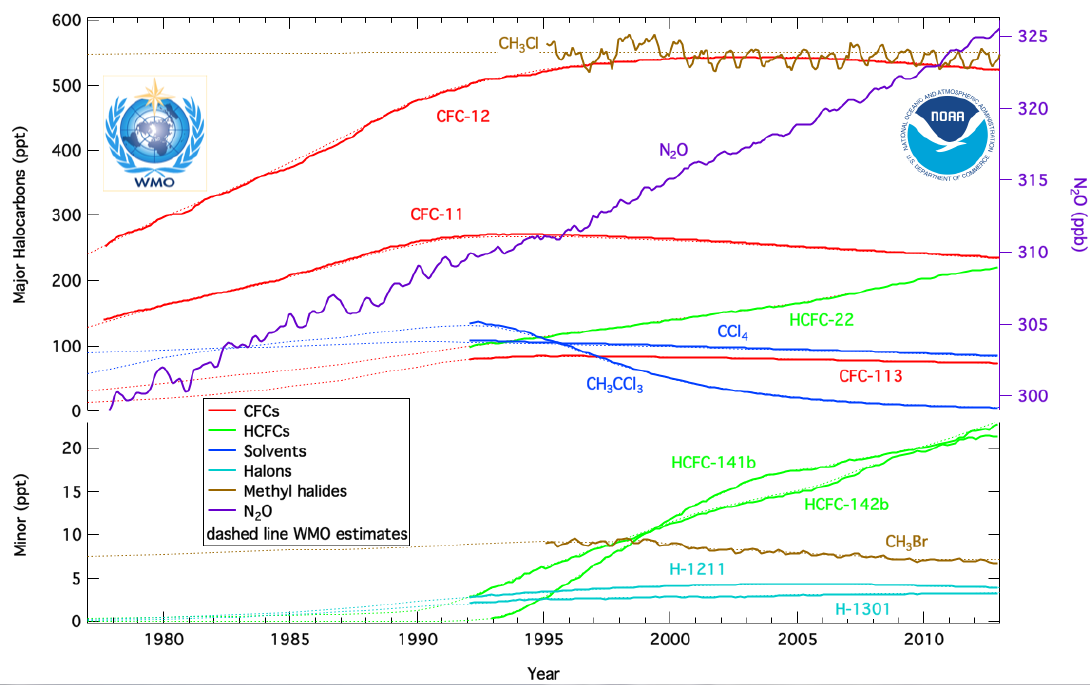
Atmospheric concentrations of important halocarbons and other chemicals at twelve sampling sites using either continuous instruments or discrete flask samples.
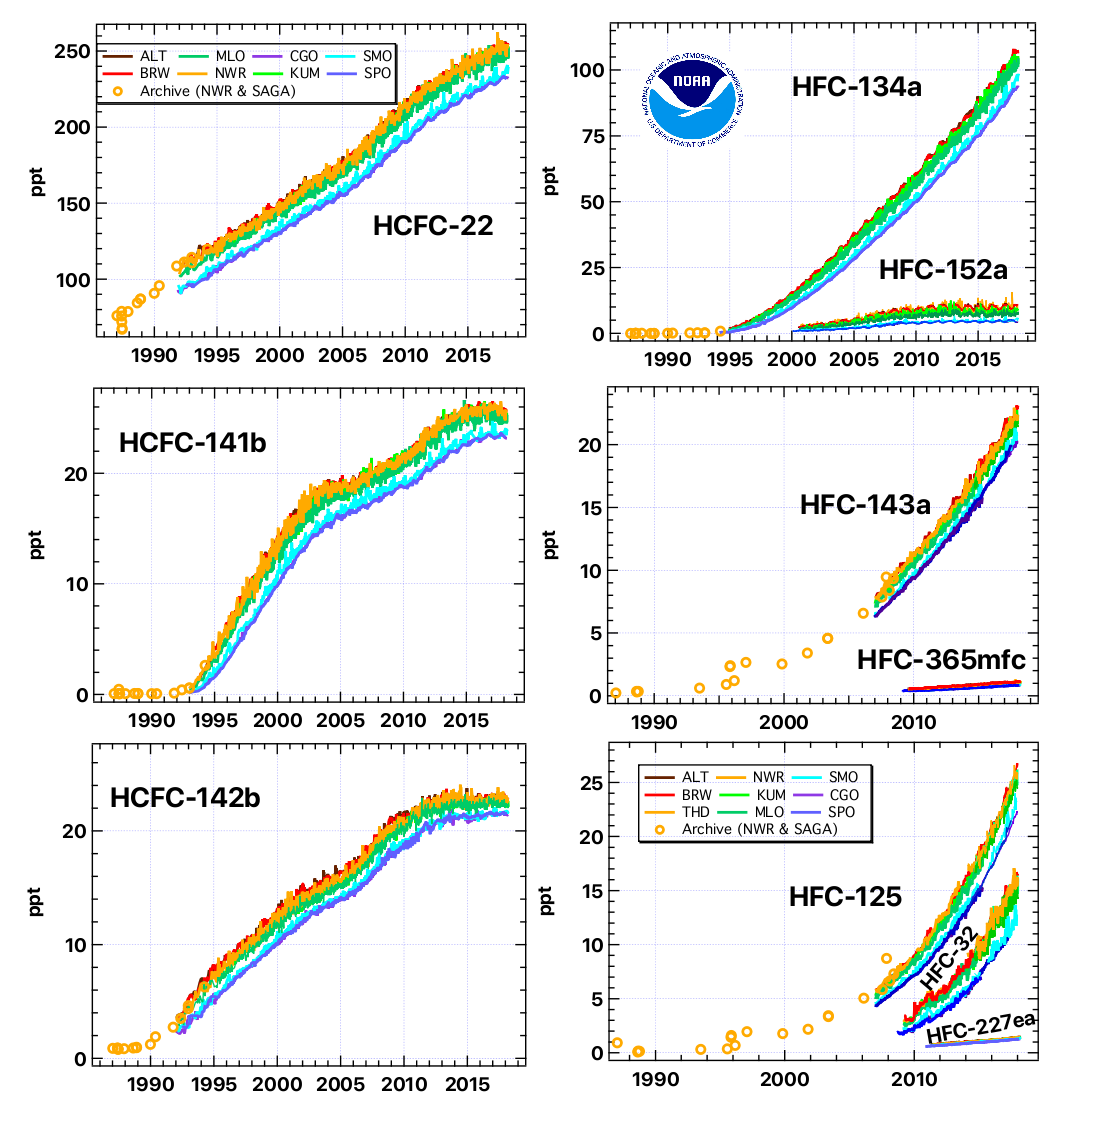
Observed Atmospheric Changes for Substitute Halocarbons from the NOAA/GML Flask Sampling Network.
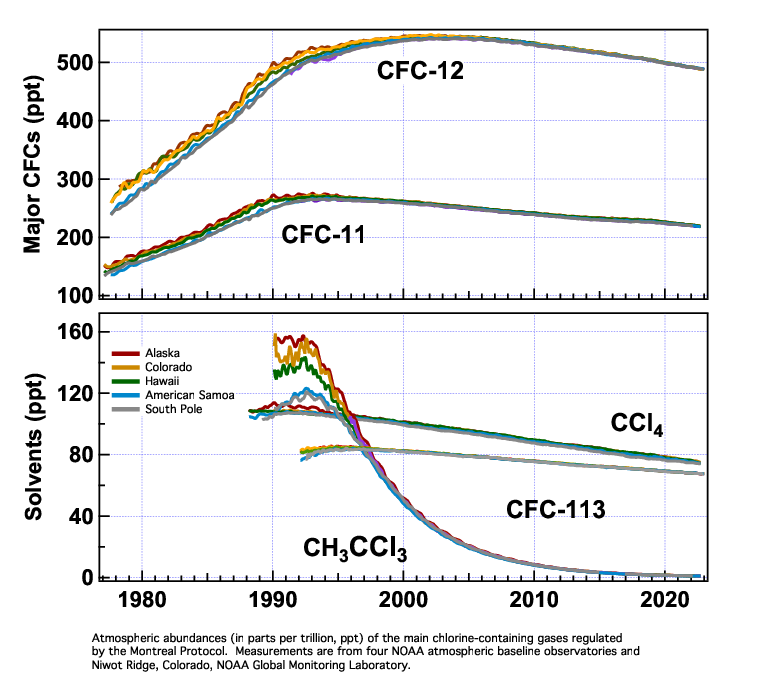
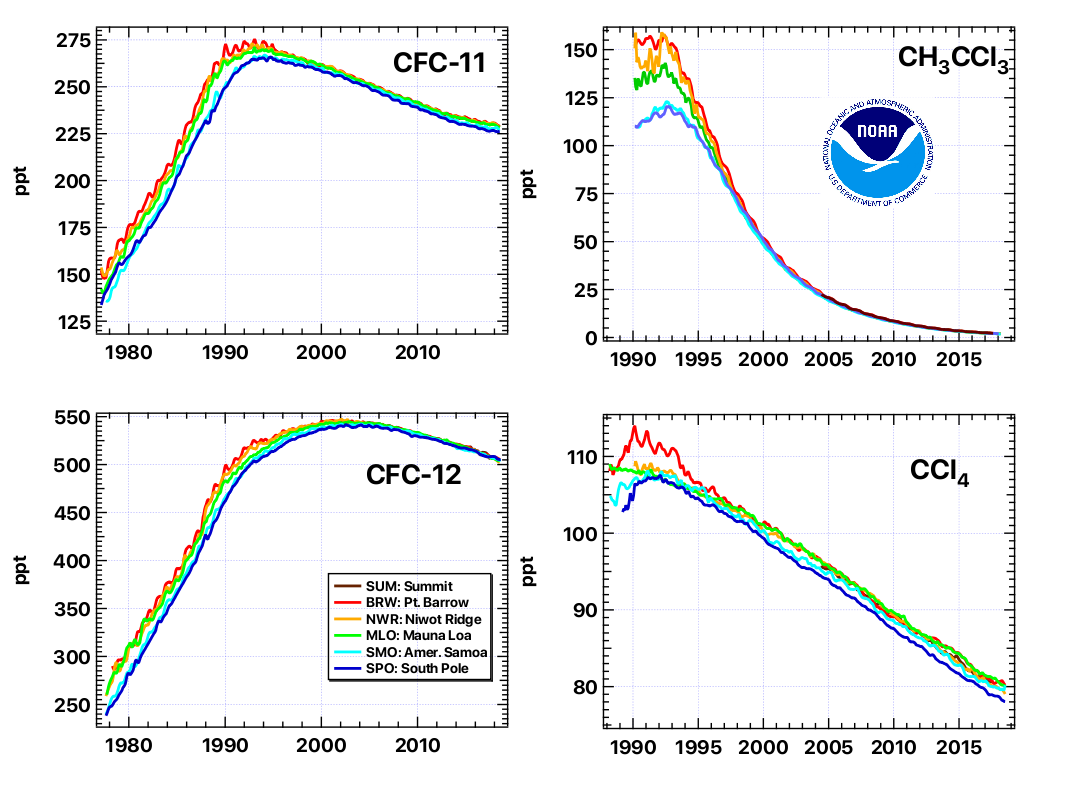
Combined datasets from for the main chlorine containing gases that are regulated by the Montreal Protocol.
Measurements are from four NOAA baseline observatories and Niwot Ridge in Colorado.
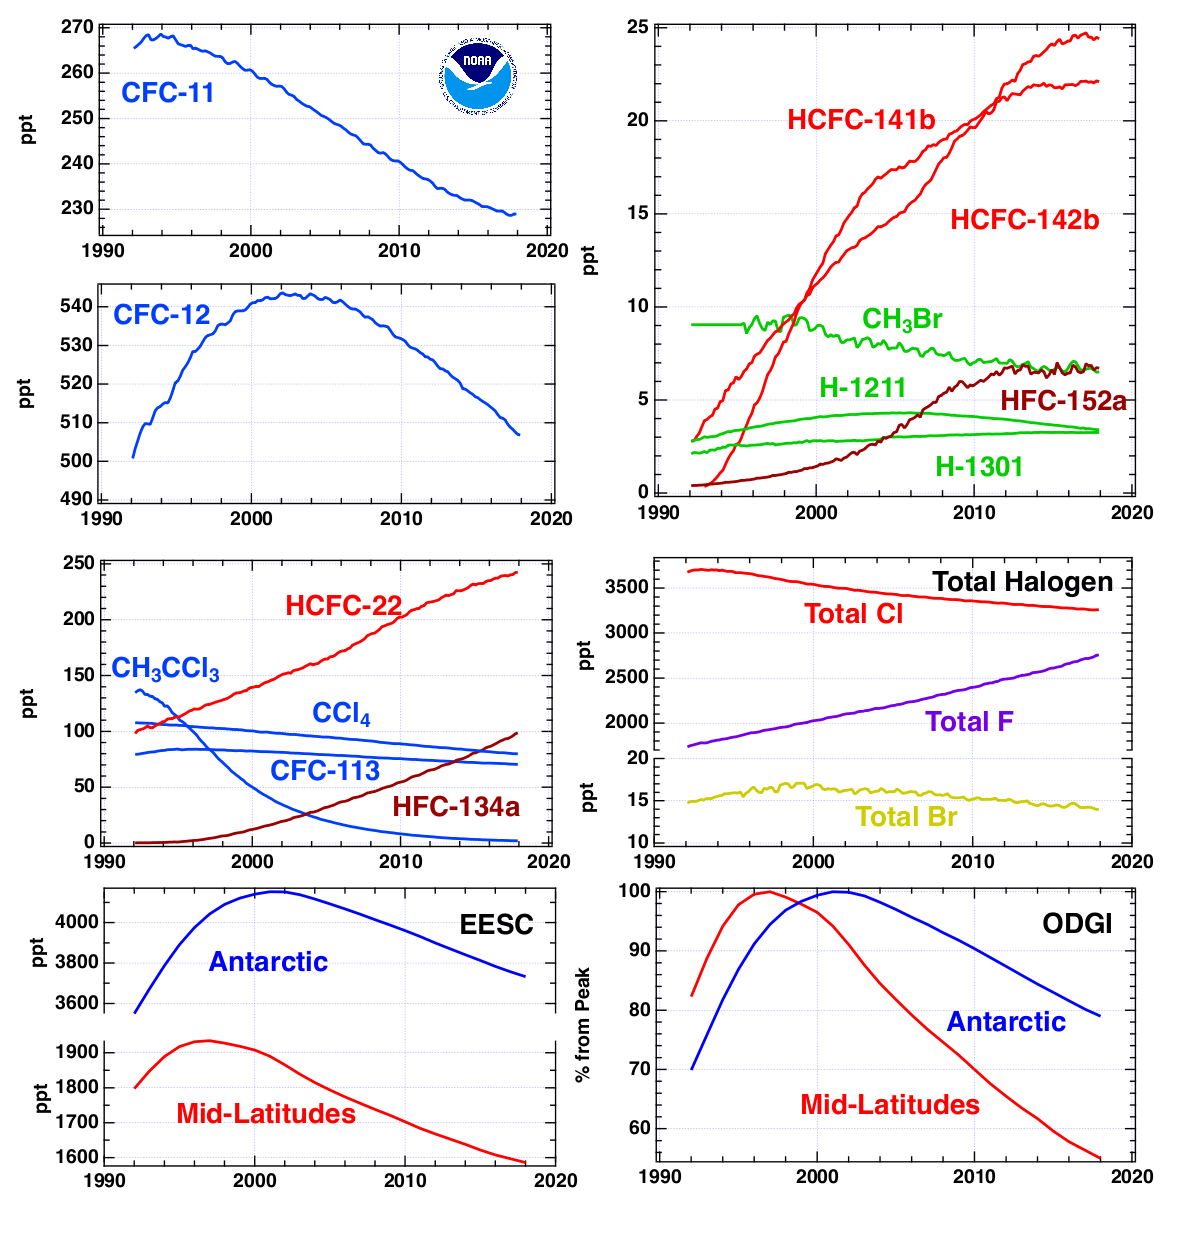
Trends of the CFCs, HCFCs, HFCs, halons, chlorinated solvents, and total halogen loading in troposphere from the GML halocarbon flask and in situ ground based network. Plots include also the effective equivalent stratospheric chlorine (EESC) and the Ozone Depleting Gas Index (ODGI) for the Antarctic and Mid-Latitudes.