
Halon-1211
There are two GML programs that measure halon-1211. The longest and most complete measurement of halon-1211 is from the HATS flask GC-MSD program (data displayed below). The CATS in situ GCs also measure halon-1211 hourly at six background air locations.
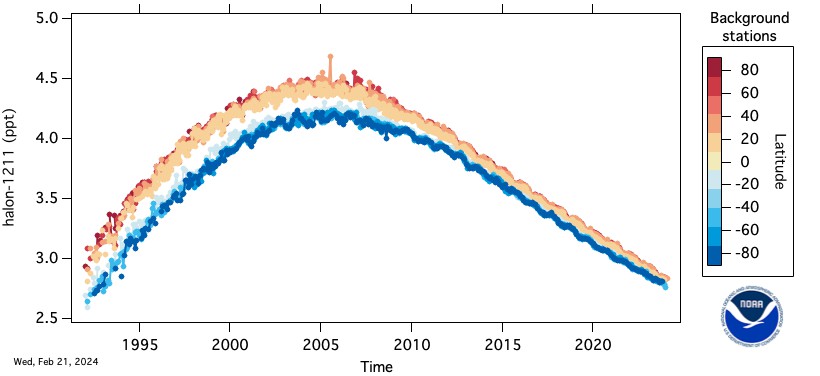
Atmospheric dry mole fractions (parts-per-trillion or ppt) of halon-1211 measured by GC-MSD in the HATS flask program. Each point represents a monthly mean at one of 8-12 stations: Alert, Canada (ALT), Summit Greenland (SUM), Barrow, Alaska (BRW), Mace Head, Ireland (MHD), Trinidad Head, California (THD), Niwot Ridge, Colorado (NWR), Cape Kumukahi, Hawaii (KUM), Manua Loa, Hawaii (MLO), American Samoa (SMO), Cape Grim, Australia (CGO), Palmer Station, Antarctica (PSA), South Pole, Antarctica (SPO).
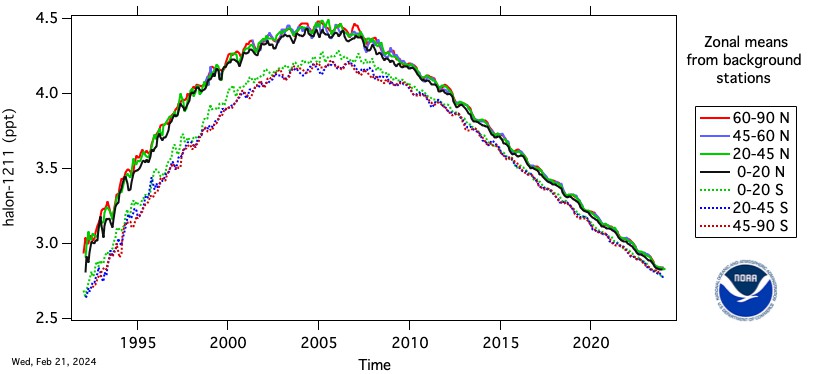
Zonal mean dry mole fractions (ppt) are estimated from flask data by equally weighting monthly mean measurements in each latitude band. Small gaps (less than 6 months) are interpolated prior to averaging. Solid lines are used for Northern hemispheric measurements and dashed for the Southern hemisphere.
Selected Publications
- Montzka, S.A, J.H. Butler, B.D. Hall, J.W. Elkins, D.J. Mondeel, A decline in tropospheric organic bromine, Geophy. Res. Lett., 30(15), 1826, doi:10.1029/2003GL017745, 2003.
- Butler, J.H., S.A. Montzka, A.D. Clarke, J.M. Lobert, J.W. Elkins, Growth and distribution of halons in the atmosphere, J. Geophys. Res., 103, 1503-1511, 1998.