
Western Arctic Climate Change
NOAA Earth System Research Laboratory, R/GML, 325 Broadway, Boulder, CO 80305-3328
Robert.Stone, Science and Technology Corporation, Boulder, CO
based on data through 1997
ACKNOWLEDGEMENTS: This study was initially supported by the National Science Foundation under grant OPP-9321547 and NOAA's Climate Monitoring and Diagnostics Laboratory.
Updated and expanded analyses can be found at: Variations and Trends of the Pacific Arctic Climate and Environmental Response.
INTRODUCTION
General circulation model (GCM) simulations indicate that the Arctic is especially prone to warming in response to globally increasing concentrations of greenhouse gases. There is observational evidence to support these predictions, some of which resembles the "fingerprint" of greenhouse-induced change that models predict. There remains, however, considerable debate as to whether the observed pattern of change is a result of anthropogenic effects or is a manifestation of natural climate variability. Following is an overview of an analysis of variations in western Arctic climate with a focus on records from the NOAA/ESRL Barrow Observatory (71.3°N, 156.6°W) (BRW), the northernmost climate monitoring site in the United States. Material and figures are adapted from Stone (1997).
Figure 1 is a map that shows the locations of four Western (or Pacific) Arctic climate monitoring stations, including BRW.
![[MAP OF THE AREA]](graphics/arcticback96.gif)
- BRW Barrow, AK (71.32°N,156.61°W)
- BTI Barter Island, AK (70.13°N, 143.63°W)
- MYS Mys Schmidt(68.92°N, 179.48°W)
- OVV Ostrov Vrangelya (70.97°N, 178.53°W)
The coastal region of the western Arctic is especially sensitive climatically because it is at the boundary between vast terrestrial and oceanic regions that are influenced by the annual snow cycle over land and sea ice distributions, particularly in the East Siberian, Chukchi and Beaufort seas. The region’s climate is further influenced by dynamical forcing from synoptic-scale pressure centers located in the North Pacific and north of Alaska.
Temperature Trends
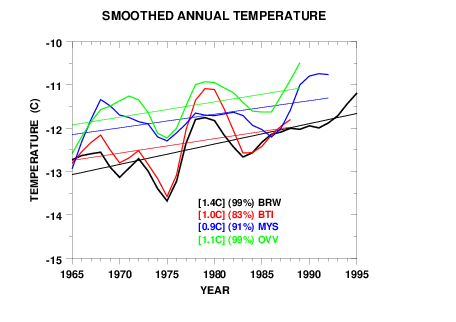
Observations from coastal sites along eastern Siberia and Alaska show very similar variations in annual temperature, with BRW being representative of the region as a whole.
In Figure 2 BRW annual mean temperatures (1965-1995) are compared with available data from Barter Island (BTI), Mys Schmidt (MYS), and Ostrov Vrangelya (OVV). Seven-year smoothed time series are shown to reveal the multiyear variability of the regional climate. Linear regressions were performed (on the actual monthly averages) and confidence levels of the fits determined on the basis of the Student t statistic for each of the time series. The analysis suggests that, from the mid 1960s warming in the western Arctic has exceeded 1.0 °C. In the case of Barrow, the 30-year trend exceeds 1.4 °C, noting that this longer record includes the very warm years of the mid 1990s. Annual and monthly (not shown) comparisons of the overlapping time series from all four stations revealed similar multiyear features, suggesting that the region as a whole is affected by similar thermodynamic processes associated with synoptic scale circulation patterns.
Arctic Cloud Effects
Thermal cloud-radiative forcing and advective processes during winter and spring are proposed as factors contributing to the regional climate variations for the period 1965-1995. To test this hypothesis, monthly mean surface and upper-level temperatures were correlated with sky cover observations and flow patterns referenced to Barrow. In addition, the radiative effects of advective cloud systems during the cold season were quantified empirically to demonstrate how clouds impact the Arctic temperature regime.
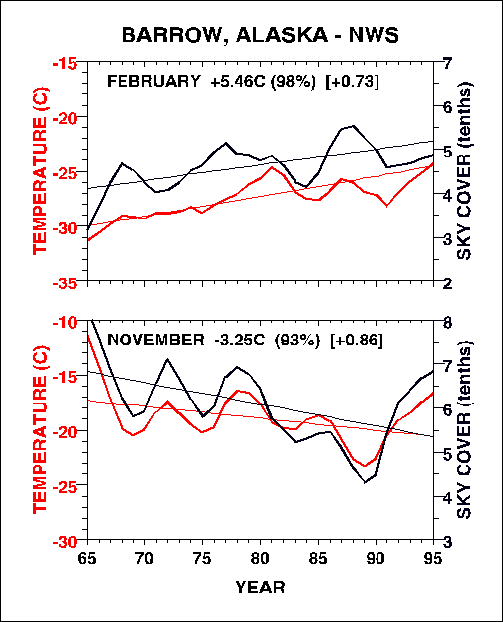
Other studies show that beginning in the mid-1970s the Aleutian Low pressure system intensified resulting in increased cyclonic activity in the north Pacific. As a result, transient disturbances may have advected more warm, moist air into the Arctic, enhancing cloudiness. As a consequence the surface and atmospheric radiative balance may have been perturbed. A quantitative illustration of how these processes can affect the temperature regime in the vicinity of Barrow is presented in Figure 3 (from Stone, 1997). The figure shows seven-year smoothed monthly average temperature and total sky cover time series and linear fits for1965-1995 for February and November. These months exhibited the most pronounced 30-year temperature changes over the period, but are of opposite sign. As much as a 3°C increase in surface air temperature is associated with a 1/10th increase in fractional sky cover during February. The legends give correlation coefficients relating temperature and sky cover. Significant positive correlations are found whether warming or cooling occurs over long time periods. For instance, the February warming and November cooling relate to an 11% increase and a 15% decrease in total sky cover, respectively. In terms of temperature, small variations in cloudiness may result in significant changes in temperature in this region of the Arctic. All months that are snow-covered in Barrow indicate positive correlations between temperature and cloudiness, an indication that cloudiness is a primary factor that controls winter surface temperatures in this region. This, in turn, is a manifestation of radiative forcing by clouds that results when thermal emissions to the surface are enhanced relative to that of the clear Arctic atmosphere as discussed in Stone (1997). More details and updates on the influence of Arctic clouds on the surface radiation budget can be found at: Barrow Radiation Climatology.
Dynamical Forcing Associated with Circulation Patterns
During the cold season, horizontal advection is suppressed within the stable Arctic boundary layer. Extensive sea ice and snow cover limits local sources of water vapor; thus cloud formation is inhibited. Therefore, the advection of heat and moisture above the inversion layer is an important factor influencing regional cloud distributions. To evaluate transport aloft, the 850 mb (between about 1350 m and 1400 m altitude) wind field above Barrow was examined. Twice-daily rawinsonde data from the National Weather Service at Barrow were used in this analysis. Here, only results for February and November are presented; these can be compared directly with coincident time series of temperature and sky cover (see Fig. 3).
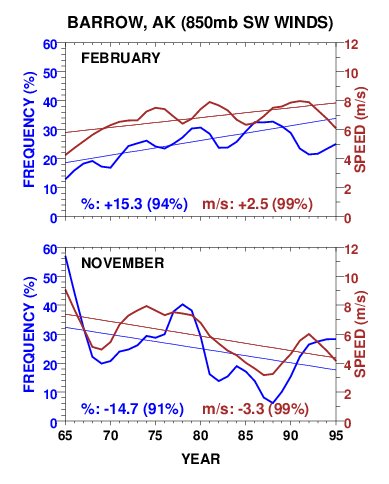
The wind data were first divided into sixteen 22.5° sectors centered at bearings of 0.0° (N), 22.5° (NNE), 45.0° (NE), etc. Then, linear regressions were computed to evaluate the frequency and speed distributions in each sector for the period, 1965-1995. For February and November southwesterly winds revealed the greatest variability. The results are presented in Figure 4, which shows seven-year smoothed time series of the frequency and average speed of southwesterlies at the 850 mb level in the vicinity of Barrow. Plot legends give the percentage increase or decrease in frequency and the change in wind speed for a 30-year period on the basis of the regressions; confidence levels are also given in parentheses. By comparing these results with those shown in Fig. 3 it is apparent that there is a physical link between the upper-level southwesterly winds, cloudiness, and surface temperatures. It appears that a long-term intensification of southwesterlies in February has contributed to the warming whereas diminishing southwesterlies in November have, on average, resulted in cooler, less cloudy conditions. Each of these trends is most likely associated with changes in synoptic-scale circulation patterns, which may not necessarily be a manifestation of global warming.
In other words, variations in western Arctic temperatures during the cold season are associated with cloud-radiative effects that, in turn, relate to advective processes. While not a direct consequence of greenhouse warming, the changes may relate indirectly to global warming through physical teleconnections that link the Arctic to the tropical and north Pacific. Warmer conditions at Barrow prevail when cyclonic activity increases in the north Pacific, resulting in the formation of clouds as air is advected northward. If instead, outflow from anticyclones that tend to form over the Beaufort Sea is dominant, colder, drier air influences the continental regions to the south. Because GCMs do not always simulate the positions and/or intensities of the Aleutian Low, Siberian High or Beaufort Sea anticyclone correctly, and these are primary centers of synoptic activity in the region, predictions of Arctic climate based on such models must be viewed with caution. Moreover, the teleconnections between tropical and polar regions are not yet fully understood.
NOTE: Further details of the impact of synoptic-scale circulation patterns on the climate of northern Alaska, and the response of the regional ecosystem can be found on the following pages:
Variations and Trends of the Pacific Arctic Climate and Environmental Response
Barrow's Annual Snow Cycle; Ecological Responses to a Lengthening Snow-free Season
REFERENCE
Stone , R.S., Variations in Western Arctic Temperatures in Response to Cloud-radiative and Synoptic-scale Influences, J. Geophys. Res., 102(D18),21,769-21,776,1997.
RELATED LINKS
- Variations and Trends of the Pacific Arctic Climate and Environmental Response
- Barrow's Annual Snow Cycle; Ecological Responses to a Lengthening Snow-free Season
- Barrow Radiation Climatology
- Instrumental Climate History for Alaska
- Barrow Weather Service Office
- ARM - North Slope of Alaska/Adjacent Arctic Ocean Site
- The Alaska Climate Research Center
RELATED ARTICLES
Bradley, R.S., F.T. Keimig, and H.F. Diaz, 1993: Recent changes in the North American Arctic Boundary layer in winter. J. Geophys. Res., 98(D5), 8851-8858.Curry, J.A., J.L. Schramm, and E.E. Ebert, 1995: On the ice albedo climate feedback mechanism. J. Climate, 8, 240-247.
Curry, J.A., W.B. Rossow, D. Randall, and J.L. Schramm, 1996: Overview of Arctic Cloud and Radiation Characteristics. J. Climate, 9, 1731-1764.
Dutton, E.G., and D.J. Endres, 1991: Date of snowmelt at Barrow, Alaska, U.S.A. Arc. Alp. Res., 23(1), 115-119.
Groisman, P.Y., T.R. Karl, and R.W. Knight, 1994: Observed impact of snow cover on the heat balance and rise of continental spring temperatures. Science, 263, 198-200.
Groisman, P.Y., E.L. Genikhovich, and P.-M. Zhai, 1996: "Overall" cloud and snow cover effects on internal climate variables: The use of clear sky climatology. Bull. Amer Meteor. Soc., 77(9), 2055-2065.
Harris, J.M., and J.D.W. Kahl, 1994: Analysis of 10-day isentropic flow patterns for Barrow, Alaska: 1985-1992. J. Geophys. Res., 99(D12), 25,845-25,855.
Isaac, G.A., and R.A. Stuart, 1996: Relationships between cloud type and amount, precipitation, and surface temperature in the Mackenzie River valley-Beaufort Sea area. J. Climate, 9, 1921-1941.
Kahl, J.D., 1990: Characteristics of the low-level temperature inversion along the Alaskan Arctic coast. Int. J. Climatol., 10, 537-548.
Kahl, J.D., M.C. Serreze, R.S. Stone, S. Shiotani, M. Kisley and R.C. Schnell, 1993: Tropospheric temperature trends in the Arctic: 1958-1986. J. Geophys. Res., 98(D7), 12825-12838.
Karoly, D.J., 1989: Northern Hemisphere temperature trends: A Possible greenhouse gas effect? Geophys. Res. Lett., 16, 465-468.
Maslanik, J.A., M.C. Serreze, and R.G. Barry, 1996: Recent decreases in summer Arctic ice cover and linkages to anomalies in atmospheric circulation. Geophys. Res. Lett., 23(13), 1677-1680.
Maykut, G.A., and P.E. Church, 1973. Radiation climate of Barrow, Alaska, 1962-66. J. Appl. Meteorol., 12, 620-628.
Robinson, D.A., K.F. Dewey, and R.R. Heim, Jr., 1993: Global snow cover monitoring: An update. Bull. Amer. Meteorol. Soc., 74(9), 1689-1696.
Santer, B.D., et al, 1996: A search for human influences on the thermal structure of the atmosphere. Nature, 382, 39-46.
Serreze, M.C., J. Box, R.G.Barry, and J.E. Walsh, 1993: Characteristics of Arctic synoptic activity, 1952-1989. Meteor. Atmos. Phys., 51, 147-64.
Serreze, M.C., J.A. Maslanik, J.R. Key, and R.F. Kokaly, 1995: Diagnosis of the record minimum in Arctic sea ice area during 1990 and associated snow cover extremes. Geophys. Res. Lett., 22(16), 2183-2186.
Stephens, G.L., 1991: Cloud radiation interaction and the earth's climate: Relevance to the climate of the Arctic. Proceedings of the International Conference on the Role of the Polar Regions in Global Change: June, 1990, Univ. of Alaska, Vol. 1, 151-157.
Stokes, G.M., and S.E. Schwartz, 1994. The Atmospheric Radiation Measurement (ARM) Program: Programmatic background and design of the cloud and radiation test bed. Bull. Amer. Meteorol. Soc., 75, 1201-1221.
Stone, R.S., and J.D. Kahl, 1991: Variations in boundary layer properties associated with clouds and transient weather disturbances at the South Pole during winter. J. Geophys. Res., 96(D3), 5137-5144.
Stone, R.S., 1993: Properties of austral winter clouds derived from radiometric profiles at south pole. J. Geophys. Res., 98(D7), 12961-12971.
Stone, R., T. Mefford, E. Dutton, D. Longenecker, B. Halter, and D. Endres, 1996: Barrow, Alaska, Surface Radiation and Meteorological Measurements: January 1992 to December 1994. NOAA Data Report. ERL CMDL-11, Boulder, CO, 81 pp.Barrow Radiation Climatology
Trenberth, K.E., 1990: Recent observed interdecadal climate changes. Bull. Am. Meteorol. Soc. 71, 988-993.
Trenberth, K.E., and J.W. Hurrell, 1994: Decadal atmosphere-ocean variations in the Pacific. Clim. Dyn., 9, 303-319.
Vowinckel, E., and S. Orvig, 1967: Climate change over the polar ocean. I: The radiation budget. Arch. Met. Geoph. Biokl. B., McGill Univ., Montreal, Canada, 1-23.
Wallace, J.M., Y. Zhang, and L. Bajuk, 1996: Interpretation of Interdecadal Trends in Northern Hemisphere Surface Air Temperature. J. Climate, 9, 249-259.
Walsh, J.E., 1993: Temperature Variations in Northern High Latitudes, 1960-1990, in Snow Watch '92 Detection Strategies for Snow and Ice, Glaciological Data Report GD-25, edited by R.G. Barry, B.E. Goodison, and E.F. LeDrew, pp. 32-43.
Walsh, J.E., and W.L. Chapman, 1990: Short-term climatic variability of the Arctic. J. Climate, 3, 237-250.
Weller, G., and B. Holmgren, 1974: The microclimates of the Arctic tundra. J. Appl. Meteorol., 13, 854-862.
Zak, B.D. and Stamnes, K. 1994: North Slope of Alaska and Adjacent Arctic Ocean Cloud and Radiation Testbed: Science and siting strategies. Proceedings of the Fourth Atmospheric Radiation Measurement (ARM) Science Team Meeting, Rep. CONF-940277, U.S. Dep. of Energy, Washington, D.C., 19-25, 1994.