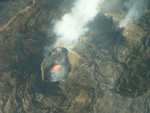
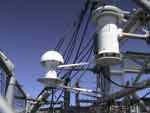
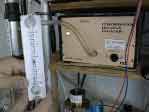
More than two years after road access and electrical power to the Mauna Loa Observatory was cut off by lava flows, NOAA staff continue to make critical measurements of the atmosphere and other environmental variables at the remote site.
In 2023, observatory staff installed solar panels at the site and resumed some measurements, including the independent carbon dioxide monitoring programs run by the Global Monitoring Laboratory and Scripps Institution of Oceanography, as well as other atmospheric measurements.
Construction of a temporary road to access the observatory site is anticipated to begin in summer 2025.
Media can contact: Theo Stein (303) 819-7409 (theo.stein@noaa.gov)
Organization(s):
![]() National Oceanic and Atmospheric Administration (NOAA),
Earth System Research Laboratory (ESRL)
National Oceanic and Atmospheric Administration (NOAA),
Earth System Research Laboratory (ESRL)
What does this program measure?
Every continuous atmospheric trace gas and aerosol measurement made at MLO can be monitored for a Mauna Loa volcanic emissions component. Significant amounts of volcanic CO2, SO2, condensation nuclei, light-scattering aerosols, and sulfate have been measured and their emission rates estimated. All other trace gases such as CO, H2, H20, CH4, O3, and Radon do not have detectable volcanic components and upper limit emission rates have been estimated for each of these.
How does this program work?
At night a temperature inversion forms near the ground, trapping volcanic emissions coming from Mauna Loa summit fumarloes in a layer tens of meters thick. Down slope winds sometimes transport these emissions to the observatory, where they are detected as a "noisy" increase above smooth baseline levels for some gases. A volcanic component can be estimated by taking the difference in concentration between periods when the plume is present and periods immediately before and after that exhibit baseline conditions. The most significant volcanic gas is CO2, which has been monitored since 1958 through three eruption cycles Volcanic CO2 is greatest shortly after an eruption and then decreases exponentially over the subsequent years. Right after the 1984 eruption, Mauna Loa emitted as much CO2 as an American city of 40,000 people. By 2005, these emissions had fallen by a factor of about 100. This suggests that a reservoir deep beneath the summit is recharged with fresh, CO2 rich magma during and immediately following an eruption which is then quiescently outgassed at an inverse-exponential rate. There were substantial emissions of SO2 and aerosols following the 1975 eruption and much lower levels were seen after the 1984 eruption. By 2000, SO2 and aerosol emissions from Mauna Loa had fallen below detection limits. The CO2 and SO2 data is examined weekly for any significant events which may signal renewed activity in the volcano. The long-term records are updated yearly.
Lead Investigator Steve Ryan of NOAA published papers on this subject in 1995, 2001, and 2006. The data used in these studies came from the SIO (pre-1974) and ESRL (post-1974) Carbon Dioxide analyzers, ESRL Meteorology system, ESRL Condensation Nuclei Counter, ESRL Aerosol Nephelometer , ESRL Sulfur Dioxide analyzer , ESRL Surface Ozone analyzer , ESRL Methane analyzer , ANSTO Radon counter, and ESRL Carbon Cycle flask program. Click here to read the 1995 paper...
Why is this research important?
Our measurements comprise the world's longest and most detailed continuous record of volcanic CO2 emissions. Measurements of volcanic gas emissions complement other geolophysical measurements (earthquake, surface deformation, gravity, petrology, and geochemistry) in providing a description of the structure and workings of Mauna Loa volcano through several eruption cycles. This knowledge may help in predicting future eruptions.
Are there any trends in the data?
The CO2 emission rate follows a very predictable exponentially decreasing trend which is established after each eruption. The slope of these trends have been different for each eruption. Current concentrations of volcanic CO2 (2006) are at their lowest levels since the record began in 1958.
How does this program fit into the big picture?
What is it's role in global climate change?
Mauna Loa volcanic CO2 was used as a tracer to constrain the flow of air around the mountain (1997 paper). The MLO CO2 emissions record (1995 and 2001 papers) is an important component in the "geophysical picture" of how Mauna Loa volcano works. The lack of significant methane emissions from Mauna Loa volcano (2006 paper) helps our understanding of the "life on Mars picture" by suggesting that Martian volcanoes are unlikely to be the source of methane in the atmosphere of Mars.
CO2 emissions from Mauna Loa volcano are an insignificantly small part of the global carbon cycle and do not play a role in climate change.
Comments and References
- Ryan, S. (1995), Quiescent outgassing of Mauna Loa volcano 1958-1994, in /Mauna Loa Revealed: Structure, Composition, History, and Hazards, Geophys. Monogr. Ser./, vol 92, pp. 95-116, AGU, Washington, D.C.
- Ryan, S. (1997), The wind field around Mauna Loa derived from surface and balloon observations, /J. Geophys. Res., 102/, 10,711-10726.
- Ryan, S. (2001), Estimating volcanic CO2 emission rates from atmospheric measurements on the slope of Mauna Loa, /Chem. Geol., 177/, 201-211.
- Ryan, S., E. J. Dlugokencky, P. P. Tans, M. E. Trudeau (2006), Mauna Loa volcano is not a methane source: Implications for Mars, /Geophys. Res. Lett., Vol. 33/, L12301, doi:10.1029/2006GL026223.
Lead Investigator(s):
Steve Ryan
808-933-6965 (x235)
MLO Contact(s):
Steve Ryan
808-933-6965 (x235)
Web Site(s)
Read a published paper on this topic...
Date Started
Study Began in 1989
Data Began
Spring, 1958


