More than two years after road access and electrical power to the Mauna Loa Observatory was cut off by lava flows, NOAA staff continue to make critical measurements of the atmosphere and other environmental variables at the remote site.
In 2023, observatory staff installed solar panels at the site and resumed some measurements, including the independent carbon dioxide monitoring programs run by the Global Monitoring Laboratory and Scripps Institution of Oceanography, as well as other atmospheric measurements.
Construction of a temporary road to access the observatory site is anticipated to begin in summer 2025.
Media can contact: Theo Stein (303) 819-7409 (theo.stein@noaa.gov)
Organization(s):
![]() National Oceanic and
Atmospheric Administration (NOAA),
National Oceanic and
Atmospheric Administration (NOAA),
Earth System Research Laboratory (ESRL)
What does this program measure?
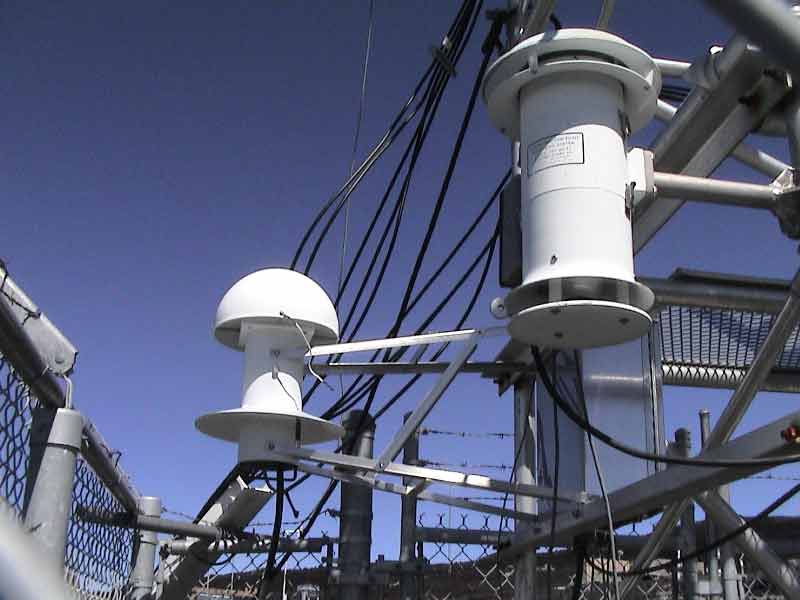
The ESRL GMD Meteorology program measures ambient and dewpoint temperatures, relative humidity, precipitation (in inches), and wind speed and direction.
How does this program work?
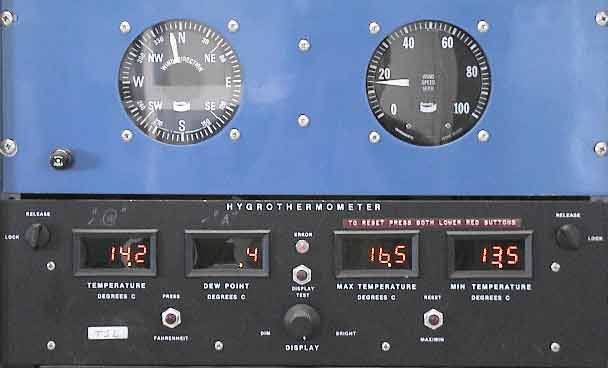
The dewpoint hygrothermometer measures ambient and dewpoint temperatures, from which relative humidity is calculated. Precipitation is continuously measured (in inches) with a tipping bucket.
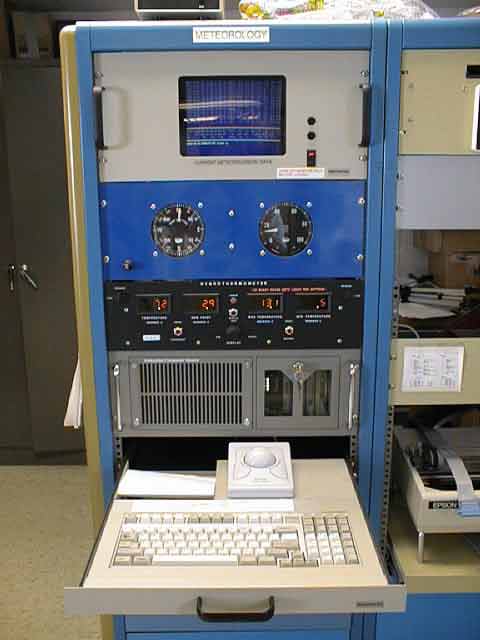
A Mauna Loa PC based system utilizes RS-485 serial communications to collect data from the instruments. The data is recorded as one minute averages, except for precipitation. Precipitation is measured as a daily total accummulation.
| Measurement | Instruments | Frequency |
|---|---|---|
| Air Temperature | Aspirated thermistor, 2m, 9m, 37mm heights | continuous |
| Air Temperature | Max/Min thermometers, 2-m height | daily |
| Temperature gradient | Aspirated thermistor, 2m, 9m, 37m heights | continuous |
| Dew point temperature | Dew point hygrometer, 2m height | continuous |
| Relative Humidity | TSL 2m height | continuous |
| Pressure | Capacitance Transducer | continuous |
| Pressure | Mercurial barometer | 5/week |
| Wind (speed and direction) | 10m, and 38m heights | continuous |
Why is this research important?
In order to monitor the trends in meteorological parameters, and to assist in the interpretation of other parameters such as aerosols.
Are there any trends in the data?
Day rose and night rose (below) show the wind direction at the observatory. Note that the night rose shows
only the southerly component which is the desired downslope conditions.
")
")
MLO press and MLO temps (below) is the running record since 1977. There is a slightly increasing trend in the
ambient temperature since 1977.


How does this program fit into the big picture?
What is it's role in global climate change?
It allows us to see how changes in other atmospheric variables affect the meteorology of the station.
Comments and References
Lead Investigator(s):
Thomas Mefford
303-497-6051
MLO Contact(s):
Matthew Martinsen
808-933-6965(x223)
Paul Fukumura
808-933-6965 (x223)
Web Site(s)
http://www.esrl.noaa.gov/
gmd/dv/met/mlo.html
Date Started
1977
Related Programs
Photographs: