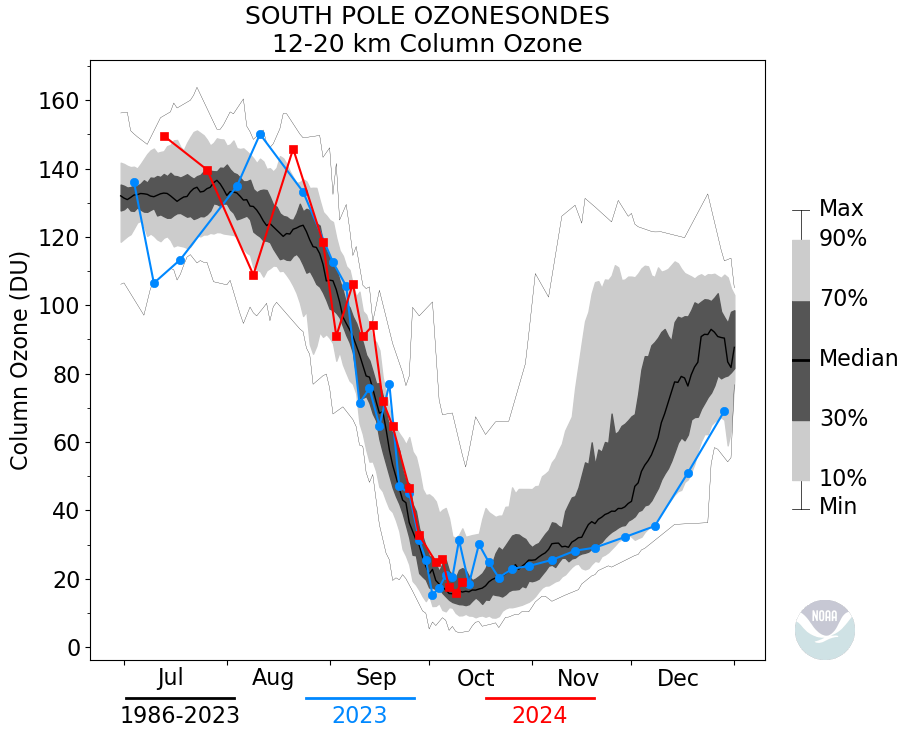
About the plot
The red line is the data for the current year and the blue line (if present) is the data for the previous year. The lines and shading follow a progression from bottom to top as the minimum (thin black line), the 10th percentile (light gray shading), 30th percentile (dark gray shading), mean (thick black line), 70th percentile (dark gray shading), 90th percentile (light gray shading), and the maximum (thin black line) over the period shown in the lower left corner.
Antarctic ozone depletion occurs primarily between the altitudes of 12 and 20 kilometers, a region where polar stratospheric clouds, necessary for the chlorine-catalyzed chemical ozone destruction process, readily form. This region is probed by high altitude balloon soundings carrying ozone sensing devices. In the figure, the amount of ozone, in Dobson Units (DU), observed by the balloonborne instruments in the 12 to 20 kilometer column at the South Pole is shown during the July 1 to December 31 period.
