About the plot
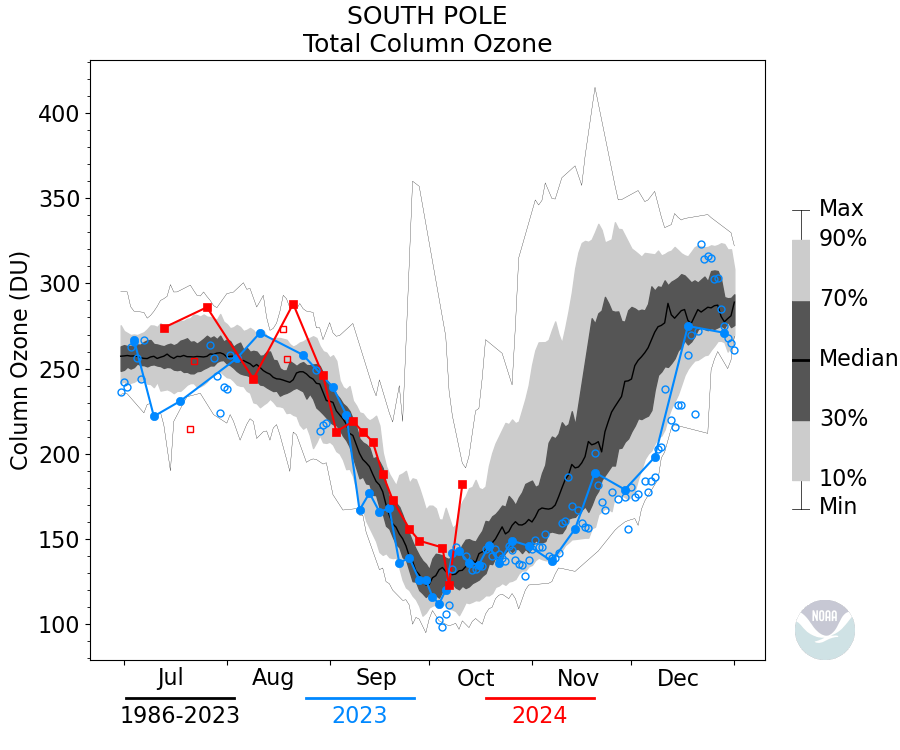
Total column ozone data from balloon soundings are shown as the larger symbols connected with a line. Dobson ozone data are shown as small size symbols (not connected) along the ozone-sonde integrated ozone column record. The red line is the data for the current year and the blue line (if present) is the data for the previous year. The lines and shading follow a progression from bottom to top as the minimum (thin black line), the 10th percentile (light gray shading), 30th percentile (dark gray shading), median (thick black line), 70th percentile (dark gray shading), 90th percentile (light gray shading), and the maximum (thin black line) over the period shown in the lower left corner.
The South Pole balloon measurements of the vertical profile of ozone can be integrated to obtain the total column ozone. During most soundings, the balloon obtains altitudes of about 30 km and does not sample the atmosphere above this altitude where 10% or less of the ozone resides. The amount to add on above the highest altitude obtained by the balloons can be estimated from ozone climatology obtained by the NOAA SBUV satellite instrument. Using this procedure, total ozone can be measured at the South Pole even in darkness when instruments which use ultraviolet radiation to measure ozone are inoperative. The total ozone determined in this way is shown in the figure for several years during the July 1 to December 31 period, which includes the spring when sunlight returns to the South Pole and the ozone hole develops.
On October 6,1993, the lowest total ozone value ever recorded on Earth (89 DU with an uncertainty of 5% using the SBUV extrapolation) was observed. This was mainly due to chlorine-catalyzed heterogeneous chemistry on volcanic aerosol particles from the Pinatubo eruption in the lower stratospheric 10-15 km region where it is normally not cold enough to form polar stratospheric clouds in great abundance. Antarctic total ozone is not expected to reach these extremely low values until another major volcanic eruption occurs during the period when stratospheric chlorine remains high (the next 20-30 years).
The Dobson Ozone Spectrophotometer was developed in the 1920's to study ozone vertical distribution and its seasonal variability in atmosphere. Total ozone column stands for the total amount of ozone in a column from the surface to the edge of the atmosphere. The first observation of total ozone at South Pole by NOAA started in 1963. This long record helps scientists to understand the pre-exisiting ozone hole conditions in the Antarctica. Dobson measurements are typically done by instrument using the Sun as reference. Ozone amount is derived by using differences between the portion of the Solar spectrum where ozone is absorbed strongly (Ultra Violet is reduced by ozone layer) and other portions of the spectrum where ozone does not absorb. During the Polar night conditions, Moon observations are possible during clear sky conditions and when the moon is full and rises high above the horizon. See more at https://gml.noaa.gov/ozwv/dobson/index.html
