Carbon Dioxide (CO2) WMO Scale
Scale conversion from X2007 to X2019
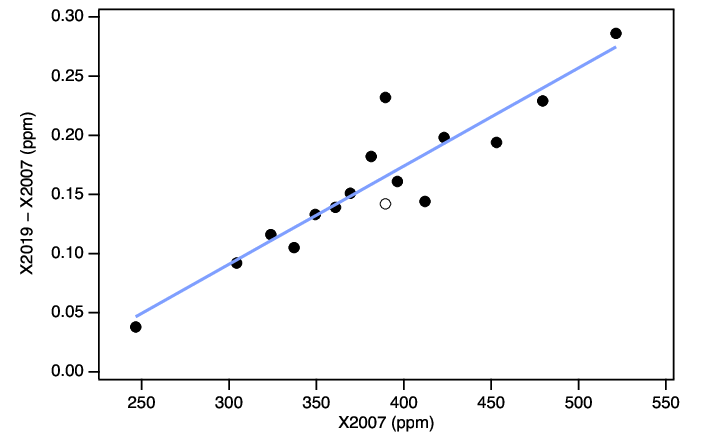
The WMO/GAW community recommended at the GGMT-2019 meeting that participating laboratories convert to the new CO2 scale within one year of its release (WMO 2020). The preferred method for converting data sets to the new scale is to retrieve calibration histories for tertiary standards on X2019, use these calibration histories to reassign working standards and reprocess atmospheric records from raw data. This ensures that mistakes that were inherent in the X2007 implementation are corrected.
We understand the difficulty in retroactively applying a scale revision to existing data sets. While we encourage laboratories to implement this scale revision as soon as practical, we feel it is important that records are on one clearly noted scale (either X2019 or X2007) and not a mixture of both. A record that is on X2007 can be incorporated into a merged data set with other records on X2019 using the linear scale conversion described below. Records that mix the two scales are much more difficult to deal with. Therefore, NOAA will carry X2007 forward in time until the end of 2022 to give users time to make a clean switch to X2019. We will report only X2019 values on official certificates but X2007 values will be available on the CCL website. After 2022 the X2007 scale will be retired and these results will be archived.
While we again recommend that laboratories reprocess atmospheric records, we realize that not all records can be reprocessed and that the effort involved may be a limiting factor. Therefore, as described in Hall et al. (2020), we provide a linear relationship derived from the primary standards between X2019 and X2007 that can be used to convert existing atmospheric data on X2007 to X2019. However, we caution that this relationship is not valid outside of the range of the X2007 scale (250 - 520 ppm).
X2019 = 1.00079 * X2007 - 0.142

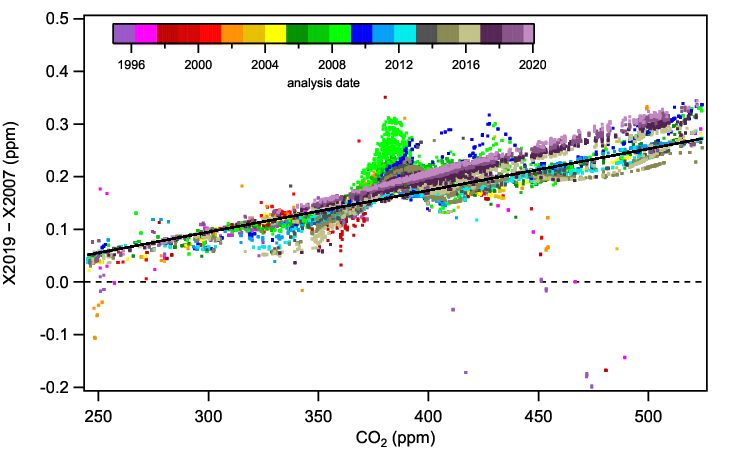
There were a few mistakes during the implementation of the X2007 scale that cause deviations from this scale relationship. First, one of the primary standards was mistakenly mis-assigned. AL47-146 was defined on X2007 as 389.64 ppm, however it was listed in a lookup table as 389.55 ppm. This coupled with the use of subsets of primary standards to calibrate secondaries (and subsets of secondary standards to calibrate tertiary standards) on the NDIR calibration system resulted in a mole fraction dependent bias in the X2007 scale centered on 389 ppm. This is an unfortunate location in mole fraction space considering the atmospheric range encountered while X2007 was in service.
In addition, from January 2008 through September 2009 one particular secondary in use was also mis-assigned causing larger deviations. CA01982, at approximately 390 ppm, drifted significantly after it went into service. The original assigned value, based on measurements made prior to its use, was never updated to account for this drift leading to a time dependent bias in tertiary standards measured on X2007.

There is also a noticeable deviation from the linear conversion for tertiary standards measured on the laser spectroscopic system, especially at higher mole fractions. These show up on figure 2 as the linear data from 2017 - 2020. Assigned values for secondary standards installed on this system were value assigned by analysis on the NDIR and therefore suffered from some of the issues encountered on the NDIR system using the X2007 scale. In addition, we expanded the calibrated range of this system in anticipation of this scale revision by using secondary standards outside of the range of the previous X2007 scale. The offsets seen between the laser spectroscopic and NDIR systems on X2007 are removed with the implementation of X2019.
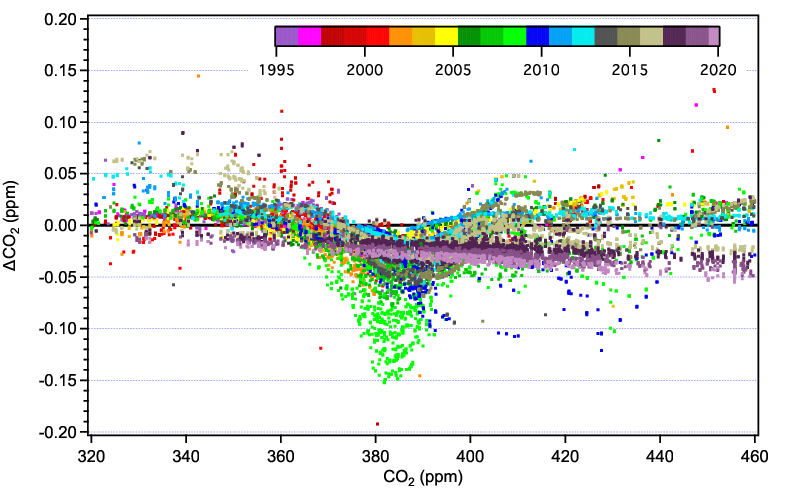
In spite of these errors, the linear scale conversion gives biases of less than 0.05 ppm for 94% of the tertiary standards over the range 320-460 ppm (Figure 3). We expect the linear conversion to be applied to atmospheric data when full reprocessing is either not possible or the effort is prohibitive. As described in Hall et al. (2020) the biases associated with applying the scale conversion to atmospheric data in the NOAA program average -0.03 ppm, but there are particular years and records when this may be up to -0.09 ppm.

References
- Hall, B. D., Crotwell, A. M., Kitzis, D. R., Mefford, T., Miller, B. R., Schibig, M. F., and Tans, P. P.: Revision of the World Meteorological Organization Global Atmosphere Watch (WMO/GAW) CO2 calibration scale, Atmos. Meas. Tech., 14, 3015–3032, https://doi.org/10.5194/amt-14-3015-2021, 2021.
- WMO, 20th WMO/IAEA Meeting on Carbon Dioxide, Other Greenhouse Gases and Related Tracers Measurement Techniques (GGMT-2019), Jeju Island, South Korea, GAW Rep. No. 255, Geneva, Switzerland, 2020.
