U.S. FlagAn official website of the United States government
icon dot gov
Official websites use .gov

A .gov website belongs to an official government organization in the United States.

icon https
Secure .gov websites use HTTPS

A lock () or https:// means you’ve safely connected to the .gov website. Share sensitive information only on official, secure websites.

×
To return to station page, click here
(Click on an image to view the corresponding statistical summary plot)
Parameter
Time Series of Monthly Average
Box and Whisker by month for the entire record
Box and whisker by month for the latest year vs. earlier years
Blue box/whiskers show the latest 12-months of available data, while black shows all data older than that.
CN
Time Series gsn N
Monthly Plot gsn N
Monthly Change Plot gsn N
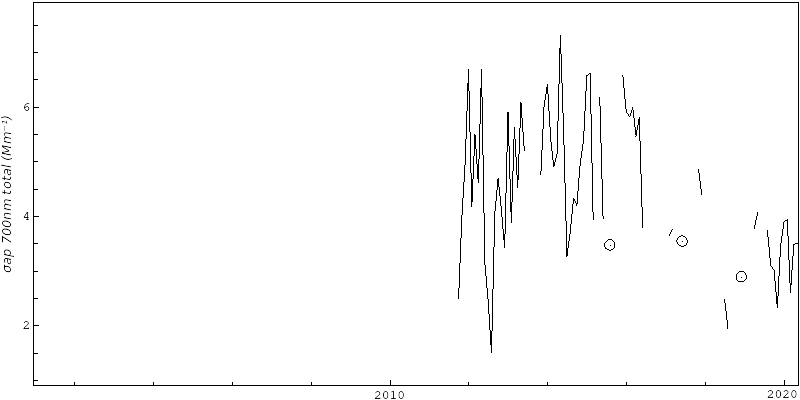
BapR (total)
Time Series gsn BaR0
Monthly Plot gsn BaR0
Monthly Change Plot gsn BaR0
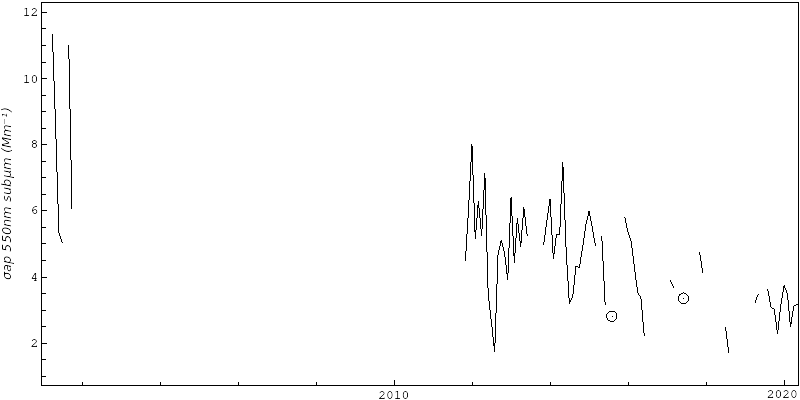
BapR (sub-µm)
Time Series gsn BaR1
Monthly Plot gsn BaR1
Monthly Change Plot gsn BaR1
BapG (total)
Time Series gsn BaG0
Monthly Plot gsn BaG0
Monthly Change Plot gsn BaG0
BapG (sub-µm)
Time Series gsn BaG1
Monthly Plot gsn BaG1
Monthly Change Plot gsn BaG1
BapB (total)
Time Series gsn BaB0
Monthly Plot gsn BaB0
Monthly Change Plot gsn BaB0
BapB (sub-µm)
Time Series gsn BaB1
Monthly Plot gsn BaB1
Monthly Change Plot gsn BaB1
BspR (total)
Time Series gsn BsR0
Monthly Plot gsn BsR0
Monthly Change Plot gsn BsR0
BspR (sub-µm)
Time Series gsn BsR1
Monthly Plot gsn BsR1
Monthly Change Plot gsn BsR1
BspG (total)
Time Series gsn BsG0
Monthly Plot gsn BsG0
Monthly Change Plot gsn BsG0
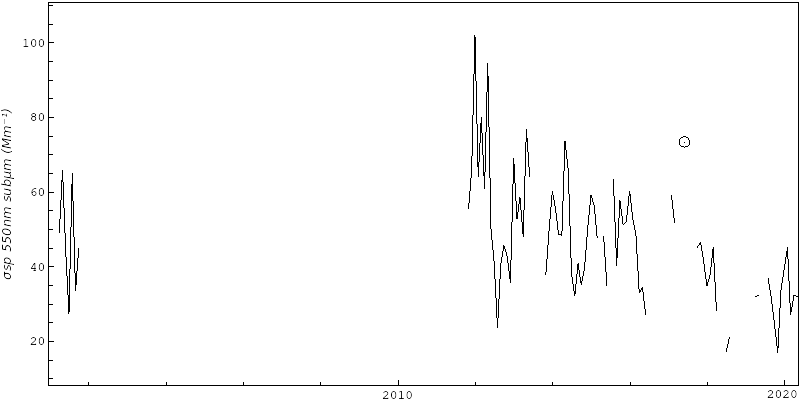
BspG (sub-µm)
Time Series gsn BsG1
Monthly Plot gsn BsG1
Monthly Change Plot gsn BsG1
BspB (total)
Time Series gsn BsB0
Monthly Plot gsn BsB0
Monthly Change Plot gsn BsB0
BspB (sub-µm)
Time Series gsn BsB1
Monthly Plot gsn BsB1
Monthly Change Plot gsn BsB1
SSA G (total)
Time Series gsn wG0
Monthly Plot gsn wG0
Monthly Change Plot gsn wG0
SSA G (sub)
Time Series gsn wG1
Monthly Plot gsn wG1
Monthly Change Plot gsn wG1
Scattering Angstrom (total)
Time Series gsn asBR0
Monthly Plot gsn asBR0
Monthly Change Plot gsn asBR0
Scattering Angstrom (sub-µm)
Time Series gsn asBR1
Monthly Plot gsn asBR1
Monthly Change Plot gsn asBR1
Absorption Angstrom BR (total)
Time Series gsn aaBR0
Monthly Plot gsn aaBR0
Monthly Change Plot gsn aaBR0
Absorption Angstrom BR (sub-µm)
Time Series gsn aaBR1
Monthly Plot gsn aaBR1
Monthly Change Plot gsn aaBR1
Backscatter Fraction R (total)
Time Series gsn FR0
Monthly Plot gsn FR0
Monthly Change Plot gsn FR0
Backscatter Fraction R (sub-µm)
Time Series gsn FR1
Monthly Plot gsn FR1
Monthly Change Plot gsn FR1
Backscatter Fraction G (total)
Time Series gsn FG0
Monthly Plot gsn FG0
Monthly Change Plot gsn FG0
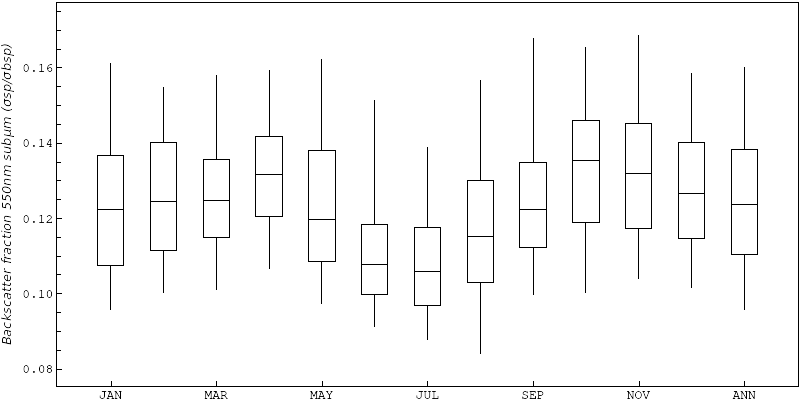
Backscatter Fraction G (sub-µm)
Time Series gsn FG1
Monthly Plot gsn FG1
Monthly Change Plot gsn FG1
Backscatter Fraction B (total)
Time Series gsn FB0
Monthly Plot gsn FB0
Monthly Change Plot gsn FB0
Backscatter Fraction B (sub-µm)
Time Series gsn FB1
Monthly Plot gsn FB1
Monthly Change Plot gsn FB1
Sub-micron Fraction BapR
Time Series gsn RaR
Monthly Plot gsn RaR
Monthly Change Plot gsn RaR
Sub-micron Fraction BapG
Time Series gsn RaG
Monthly Plot gsn RaG
Monthly Change Plot gsn RaG
Sub-micron Fraction BapB
Time Series gsn RaB
Monthly Plot gsn RaB
Monthly Change Plot gsn RaB
Sub-micron Fraction BspR
Time Series gsn RsR
Monthly Plot gsn RsR
Monthly Change Plot gsn RsR
Sub-micron Fraction BspG
Time Series gsn RsG
Monthly Plot gsn RsG
Monthly Change Plot gsn RsG
Sub-micron Fraction BspB
Time Series gsn RsB
Monthly Plot gsn RsB
Monthly Change Plot gsn RsB